Does explaining an AI moderator make it easier to trust?
1University of Central Florida · 2University of Waterloo
Workshop paper · WEB&GRAPH 2026: Workshop on Web & Graphs, Responsible Intelligence, and Social Media at WSDM 2026, Boise, ID, USA
🏆 Best Paper Award
Quick facts
A threat classifier can be accurate and still hard to act on if moderators cannot see why it chose a label. We put a classifier’s prediction next to three kinds of explanations and measured how much 31 people trusted it, how clear they found it, and how long they took. Led by Kamalakkannan Ravi (University of Central Florida). Overall, our work contributes:
- An evaluation framework for trust and explainability, built into a live moderation interface that places three complementary explanation views next to the model’s prediction and maps them to measured trust, usability, and perceived effectiveness.
- A within-subjects user study (n=31) of how explanation clarity, response time, and format affect trust, usability, and moderation behavior.
- Statistical evidence linking explanation clarity to trust, and trust to perceived moderation effectiveness.
- Design guidelines: prioritize low cognitive load visualizations, keep response times fast enough for real-time decisions, and explore hybrid explanation formats.
Abstract
As online social platforms face increasing challenges in moderating nuanced threats across web communities, trust in automated moderation systems is critical. TRuST-M examines this problem in web and social-network environments, where moderation occurs under time pressure and public scrutiny. Large language models (LLMs) achieve strong classification performance but remain difficult to interpret, reducing user confidence and accountability in real-world workflows. This work introduces TRuST-M, a human-centered evaluation framework that studies how explanation methods influence trust, understanding, and perceived effectiveness in LLM-based threat moderation. The framework integrates a RoBERTa model pretrained on 1M Telegram posts and fine-tuned on 15,063 labeled messages across three classes (No Threat, Judicial Threat, Non-Judicial Threat), achieving 95.8% accuracy, weighted F1 of 0.96, and Cohen’s kappa of 0.94 on a held-out set. A within-subjects study (n=31) evaluated six messages of varying complexity with predictions and three explanation methods: Integrated Gradients, LIME, and attention visualization. LIME was preferred by 58% of participants for its intuitive word-level highlights, though longer response times were noted, while attention visualizations were rated least helpful due to unclear token emphasis. Statistical analysis revealed positive correlations between explanation clarity, user trust, and confidence in moderation decisions. We frame TRuST-M as an interpretable decision-support system for human-in-the-loop moderation, emphasizing calibrated trust and moderator comprehension rather than model replacement. The findings show that explanation clarity and response time meaningfully shape trust and decision confidence in AI-assisted moderation, advancing transparent, usable, and trustworthy moderation tools for the social web.
The idea: one verdict, three explanations
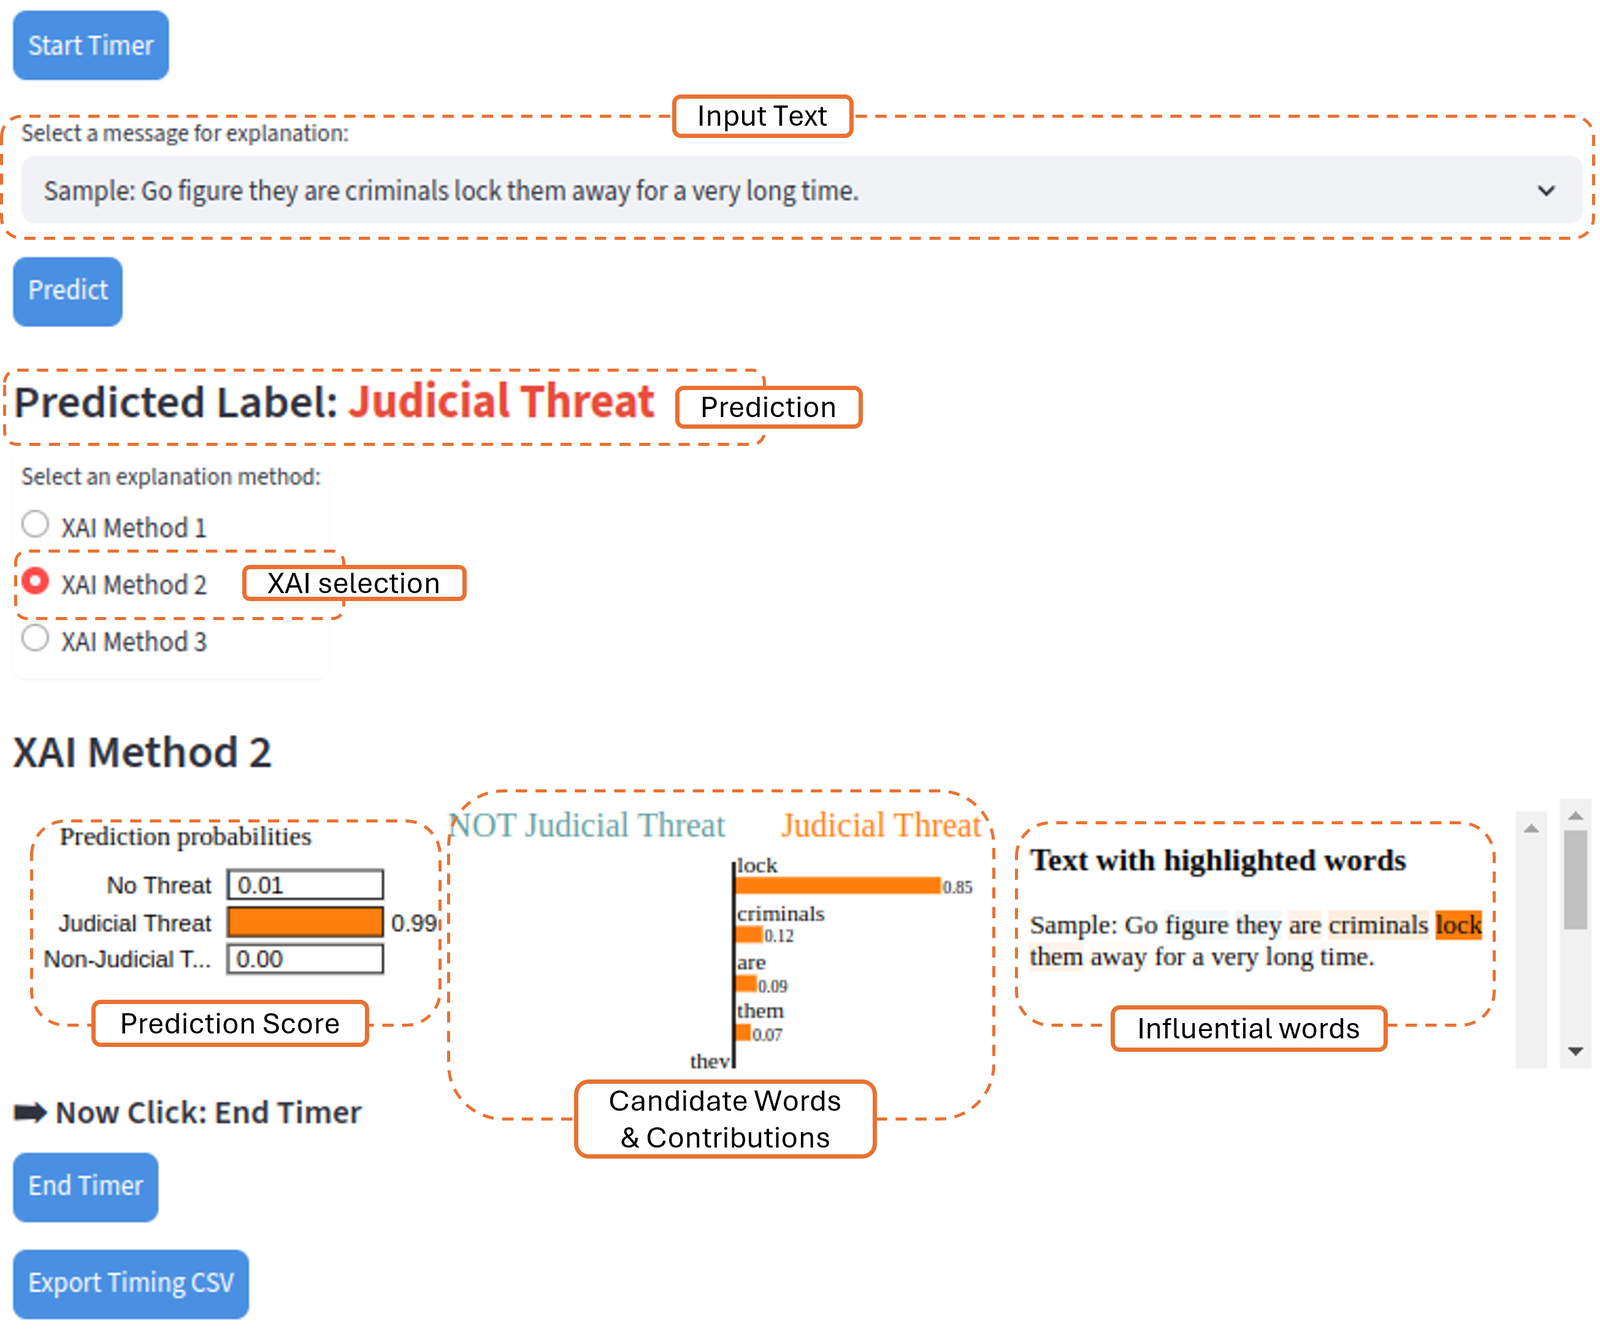
TRuST-M stands for Threat Reasoning and User Study of Trust in Moderation. The goal is to support a human moderator, not replace one. A participant picks a message, the classifier labels it, and three explanation methods each show which words drove the label. We then asked whether people trusted the label, whether the explanations were clear, and whether the tool would help them moderate.
The classifier uses a three-class taxonomy that separates lawful punitive speech from calls for violence:
- No Threat: strongly worded but non-harmful expressions (“Live free or die”).
- Judicial Threat: advocacy for legal or punitive action (“Lock her up”).
- Non-Judicial Threat: direct or implied calls for unlawful violence (“It’s time to start a civil war”). Mixed cases default to this class.
System
Data. We collected replies from far-left and far-right Telegram channels (far-right content dominated because those channels post more). Of 2.3M replies, 15,076 were annotated with criminology-informed guidelines, and 15,063 remained after resolving borderline cases. We split them into training (10,554), development (2,248), and test (2,261) sets.
Model. We first pretrained RoBERTa on 1M unlabeled Telegram replies (12,260 steps, about 137 hours) and then fine-tuned it on the labeled set for 100 epochs (about 168 hours). On the held-out test set it reached 95.8% accuracy, a weighted F1 of 0.96, and a Cohen’s kappa of 0.94.
Interface. The Total Freedom Interface is a web app built with Streamlit. A participant selects a message, presses Predict, sees a color-coded label with class probabilities, and then opens each explanation method. Each method uses its own view (heatmaps, bar charts, or token highlighting). The interface logs the time from Start Timer to End Timer for each message.
Study
Task. Each participant reviewed six Telegram replies from the test set, two per class: one “easy” (explicit threat markers, unanimous annotator agreement) and one “hard” (implicit, sarcastic, or context-dependent language). For every message they viewed the prediction and examined all three explanation methods. The message order was fixed.
Participants. 31 people (15 female, 16 male) aged 18 to 44. Thirteen had prior moderation experience, including two professional moderators, and 81.2% had never used an explainable AI tool.
Procedure. About 30 minutes: an onboarding demo with a neutral example and a content warning (5 minutes), the six messages (10 to 15 minutes), and a survey with open-ended feedback (10 minutes).
Measures. Interaction time per message; 1 to 5 ratings of trust in the model, perceived explainability, and moderation effectiveness; a 19-item usability assessment; and open-ended comments. After cleaning (fewer than 4% of trials dropped), the data covered 558 explanation interactions and 186 timed tasks.
What do we learn?
1. Clearer explanations went with more trust
Participants who found the explanations clearer also trusted the model more (Spearman ρ = 0.493, p = 0.005). Trust in turn correlated with perceived moderation effectiveness (ρ = 0.62, p < 0.01), and so did explainability (ρ = 0.66, p < 0.01). So even with a model that is 95.8% accurate, trust went hand in hand with understanding its output.
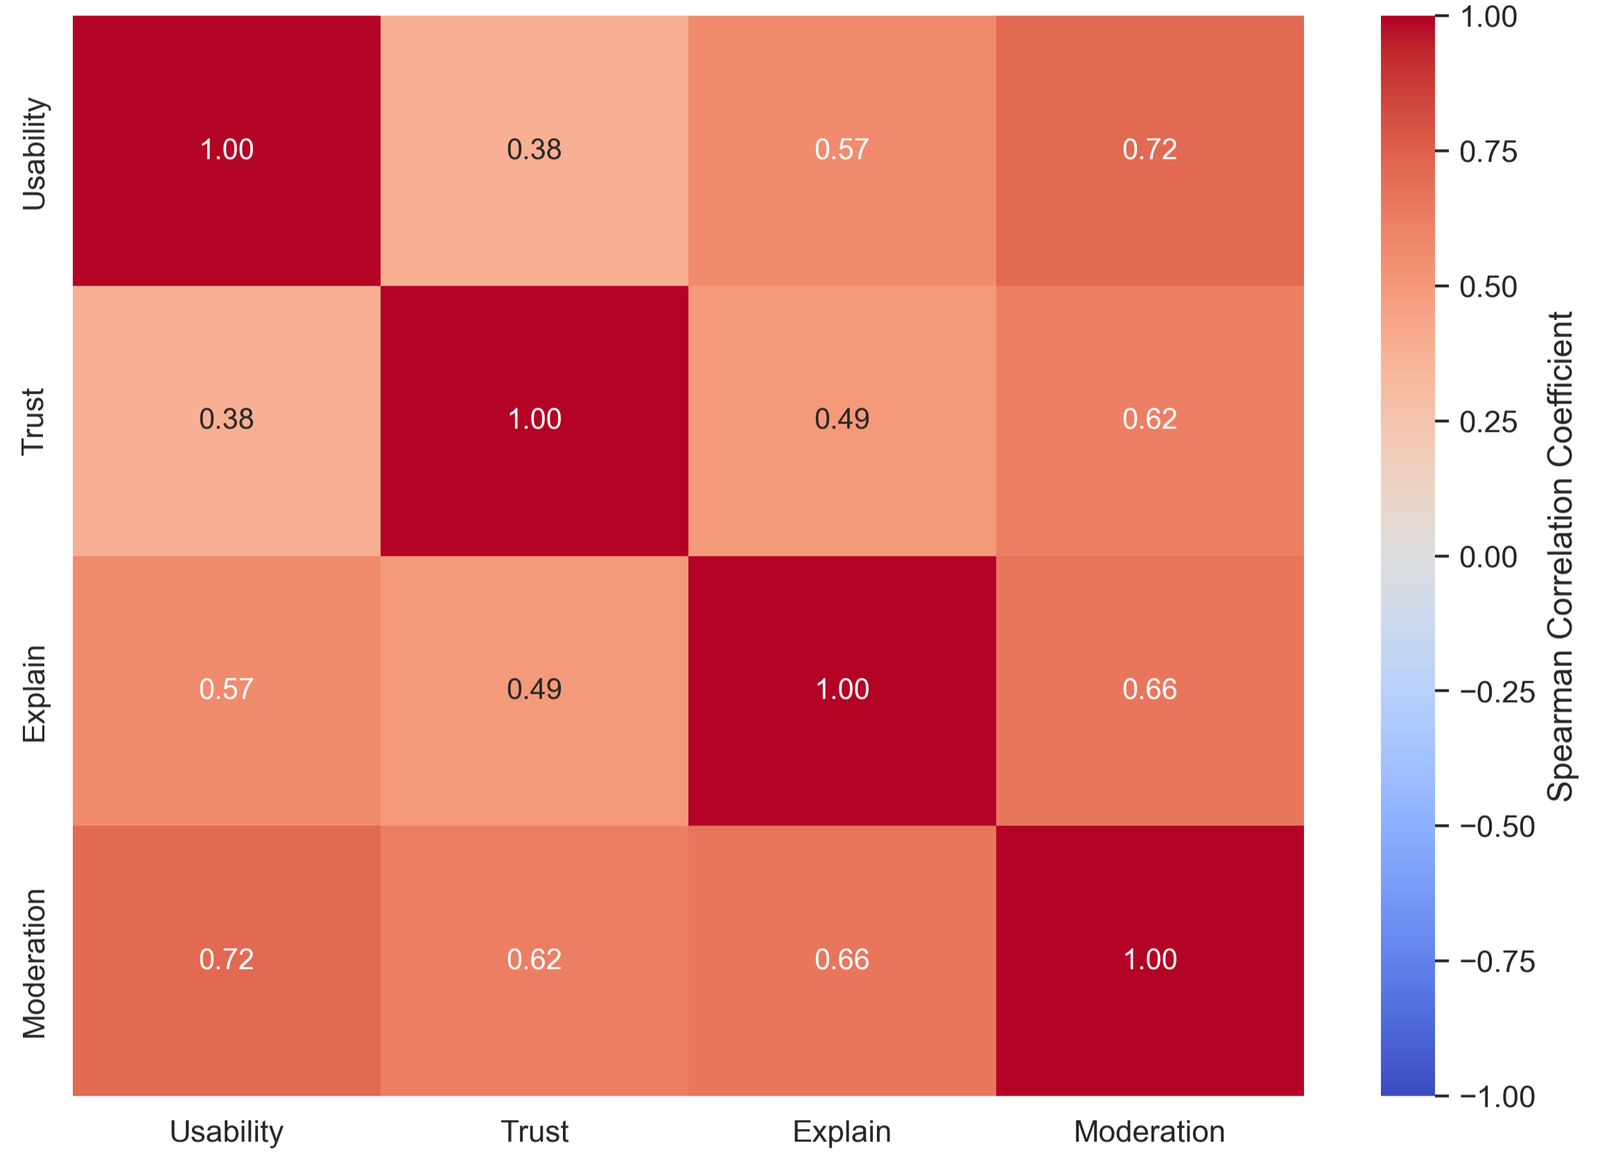
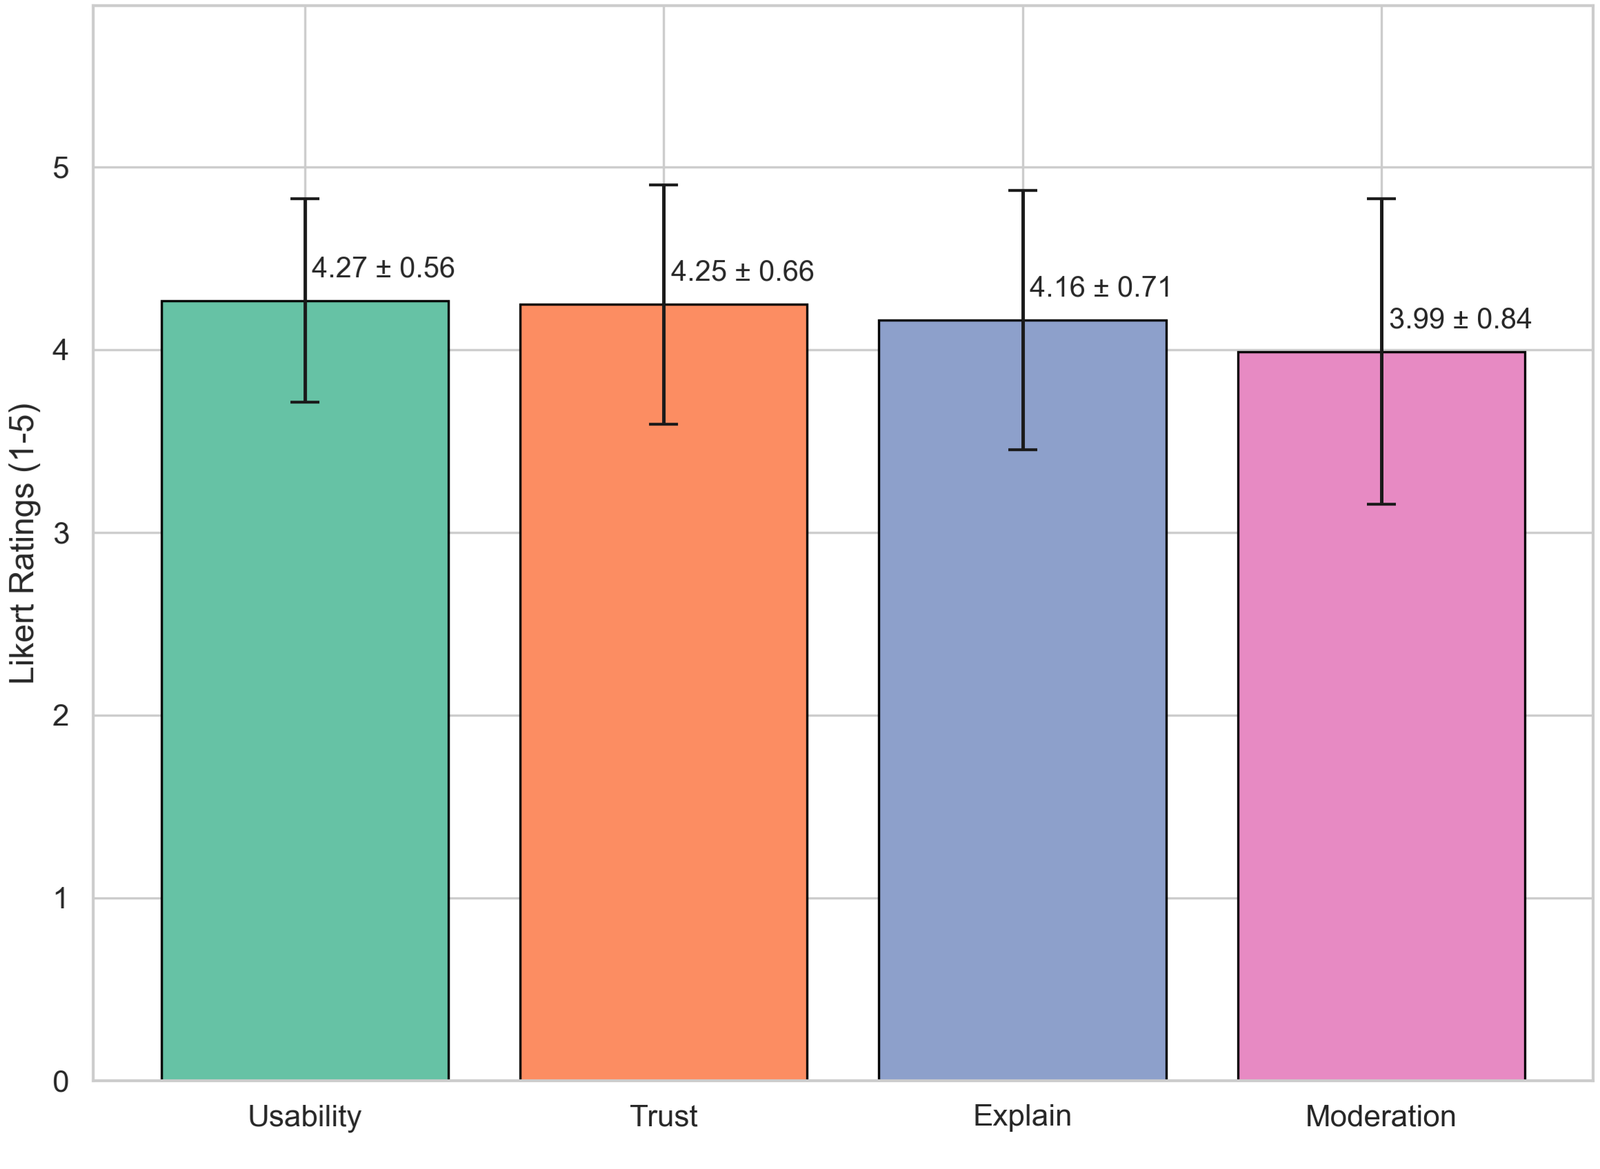
Usability got the highest ratings (mean 4.27, SD 0.56) but correlated less with trust (ρ = 0.38, p < 0.05) than clarity did. Comments said the hard part was interpreting the explanations, not using the controls. Usability helps, but it is not enough for trust. Education level was linked to usability satisfaction: 83% of PhD holders rated the system “Excellent” or “Best Imaginable”, while 50% of Bachelor’s degree holders rated it “Good” or “Fair” (χ²(6, N=31) = 20.99, p < 0.05). We found no significant effects of gender, age, or prior AI/ML experience.
2. LIME was the favorite, attention the least helpful
18 of 31 participants (58%) preferred Method 2 (LIME) for its color-coded highlights and ranked word importance. P23: “Method 2 was the most helpful, as it clearly separated the words that were important for the label given.” The catch was speed. P10: “Faster XAI method 2 implementation would help [for a] real-world use case.”
Method 3 (attention) drew the most criticism for confusing scores and emphasis on uninformative tokens. P19 noted that it “was often giving higher attention to special tokens like inverted commas”. Many participants were also confused when different methods highlighted different words for the same message, and a few suggested combining methods. P13 thought combining Methods 2 and 3 “would be easier for general people to interpret”.
3. Messages that looked severe got a second look
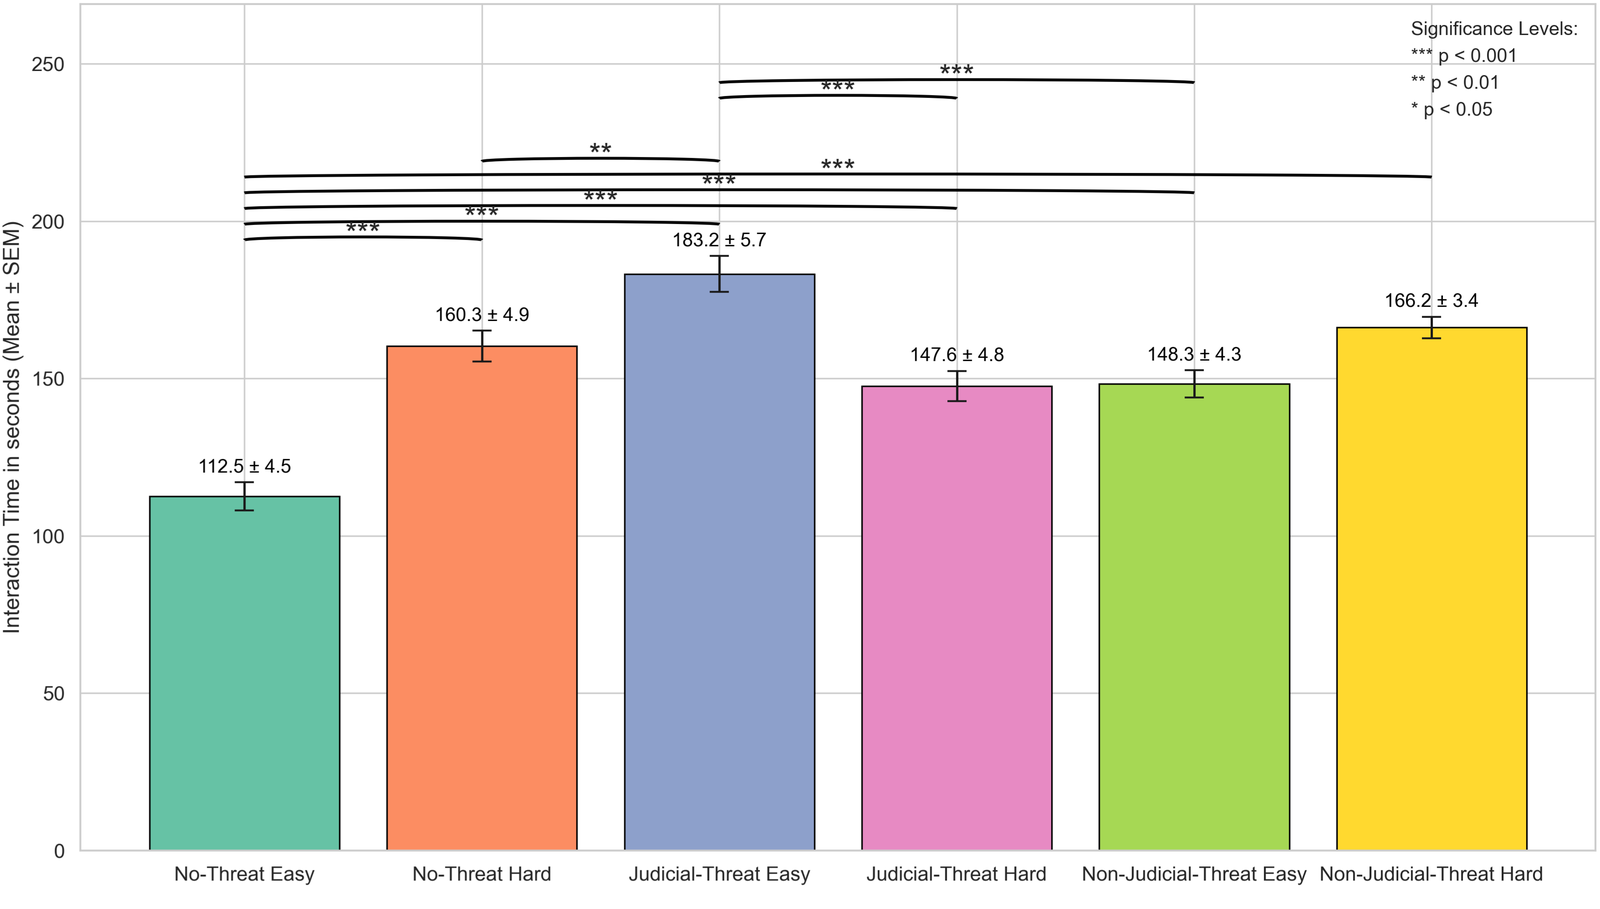
Hard messages usually took longer: the easy No Threat message took 112.5 s on average and its hard counterpart 160.3 s. The exception was the judicial threat: the easy one took the longest of all six (183.2 s), longer than the hard one (147.6 s). When content looks clearly severe, people may spend extra time checking the AI’s output before accepting it.
Design implications
- Prioritize simple, local visualizations. Highlight the words that matter and avoid visual clutter.
- Treat latency as a first-class design constraint. The preferred method (LIME) was also slow to respond, and slow explanations lose value in fast-paced moderation.
- Adopt hybrid explanation strategies. Combine word-level highlights with lightweight visual overviews.
- Match explanation depth to risk. Offer a quick review mode for routine items and a deep review mode for critical or ambiguous ones.
Limitations
The study had 31 participants and only two professional moderators, so the results may not hold for expert teams or large-scale operations. Message order and the mapping of method labels were fixed, which may have introduced order and framing effects. It was a single-session lab study, and LIME’s latency was noted by participants but not quantified. The training data came mostly from far-right channels, which may skew predictions and increase false positives for some ideological groups. Future work includes cohorts of more than 50 moderators across platforms, randomized designs, and field deployments.
Publication
Kamalakkannan Ravi, Hemant Surale, and Jiann-Shiun Yuan. 2026. TRuST-M: Evaluating User Trust and Explainability in LLM-Based Web Moderation Systems. In The Nineteenth ACM International Conference on Web Search and Data Mining (WSDM Companion ’26), Boise, ID, USA. ACM, 73-83. https://doi.org/10.1145/3779211.3793172. Presented at the WEB&GRAPH 2026 workshop.
BibTeX
@inproceedings{ravi2026trustm,
  title     = {TRuST-M: Evaluating User Trust and Explainability in LLM-Based Web Moderation Systems},
  author    = {Ravi, Kamalakkannan and Surale, Hemant and Yuan, Jiann-Shiun},
  booktitle = {Proceedings of the Nineteenth ACM International Conference on Web Search and Data Mining},
  series    = {WSDM Companion '26},
  location  = {Boise, ID, USA},
  pages     = {73--83},
  year      = {2026},
  publisher = {ACM},
  doi       = {10.1145/3779211.3793172}
}
Contact
Questions? Feel free to contact:
- Kamalakkannan Ravi, University of Central Florida: Kamalakkannan.Ravi [at] ucf.edu
- Hemant Bhaskar Surale, University of Waterloo: hemant.surale [at] gmail.com
Figures from the paper are reproduced under its CC BY 4.0 license.